| (US$ million) |
2024 |
2023 |
2022 |
2021 |
| For the year |
|
|
|
|
| Gross Operating and Other Income |
321 |
277 |
169 |
183 |
| Operating Expenses |
55 |
53 |
47 |
47 |
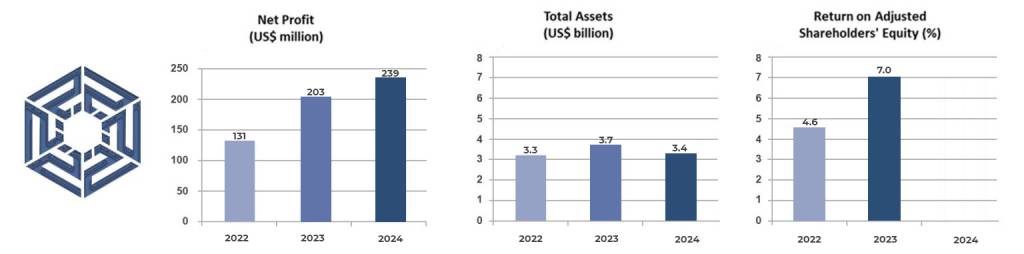
| Net Profit |
239 |
203 |
131 |
130 |
| At year end |
|
|
|
|
| Total Assets |
3,446 |
3,690 |
3,331 |
3,189 |
| Interest Bearing Securities and Funds |
422 |
507 |
355 |
539 |
| Equities and Managed Funds |
793 |
744 |
608 |
437 |
| Projects and Equity Participations |
2,012 |
2,070 |
1,926 |
1,711 |
| Deposits |
409 |
792 |
431 |
314 |
| Shareholders’ Equity |
2,885 |
2,802 |
2,688 |
2,608 |
| Selected Ratios (%) Profitability |
|
|
|
|
| Return on Paid-up Capital |
11.4 |
9.7 |
6.2 |
6.2 |
| Return on Adjusted Shareholders’ Equity |
— |
7.0 |
4.6 |
4.8 |
| Capital
BIS Ratio |
|
|
|
|
| – Total |
33.0 |
33.4 |
30.7 |
41.3 |
| – Tier 1 |
33.0 |
33.4 |
30.7 |
41.3 |
| – Shareholders’ Equity as a % of Total Assets |
83.7 |
75.9 |
80.7 |
81.8 |
| Asset Quality |
|
|
|
|
| Marketable Securities as a % of Total Assets |
25.1 |
23.8 |
19.6 |
22.8 |
| GCC Country Risk as a % of Total Assets |
— |
68.1 |
71.5 |
77.9 |
| Liquidity |
|
|
|
|
| Liquid Assets Ratio |
40.4 |
42.4 |
39.6 |
42.6 |
| Productivity |
|
|
|
|
| Operating Income as Multiple of Operating Expenses |
5.8 |
5.2 |
3.6 |
3.9 |